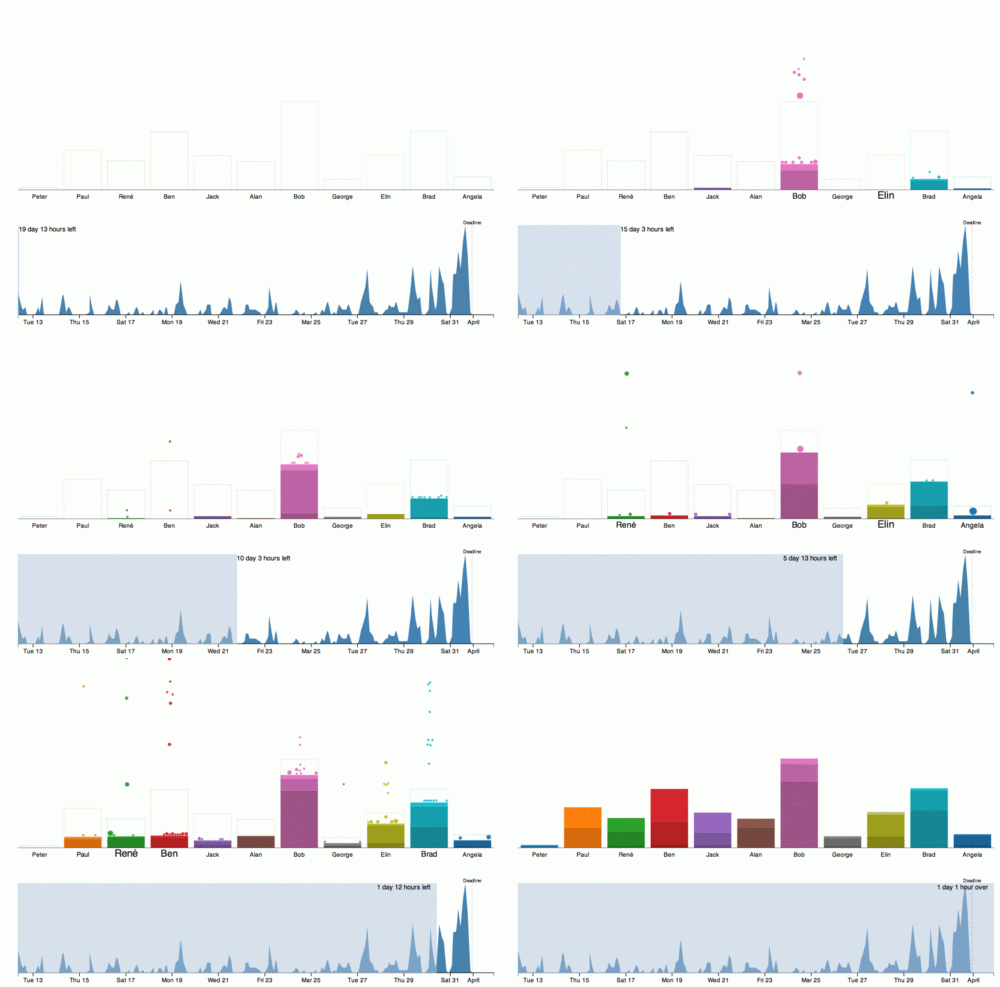
An interactive visualization that uses our Visual Sedimentation toolkit. It basically replays 20 days of SVN commits (code, article) before the crunch of a deadline. The visualization is voluntarily left interactive without any annotation or particular highlight on what’s interesting.

So, what’s in the crunch of the deadline? At least three interesting things that become visible.
Pong patterns
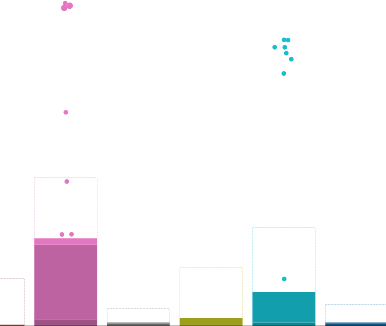
Bob (pink) and Brad (green) are actually respectively a student and his advisor. As you brush the data, they alternatively push commits one after the other as they were playing a pong game.

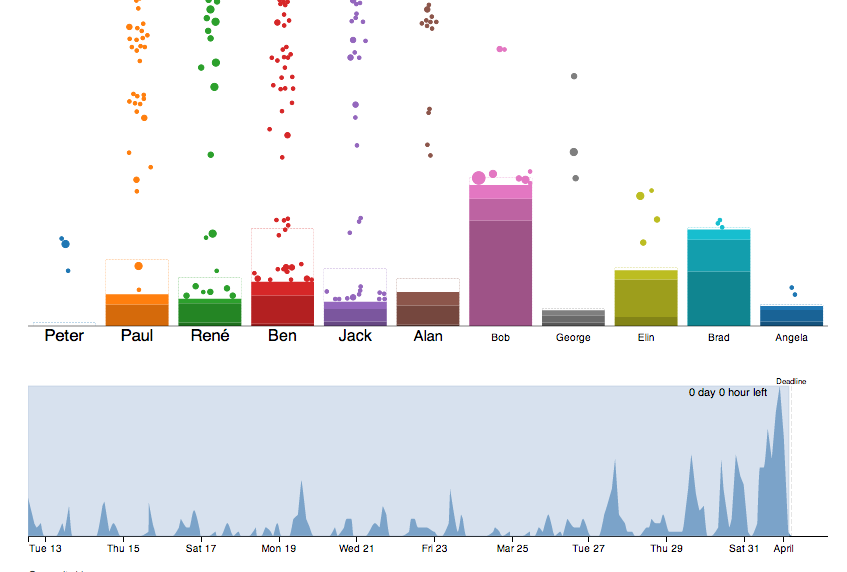
The crunch
Well, quite self-explanatory.

Last minute strata
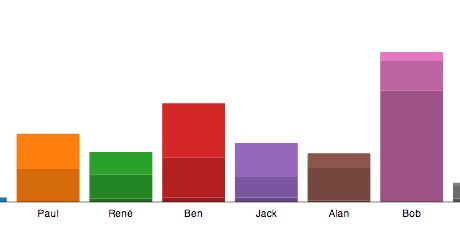
Once the crunch is over, latest updates are still visible: Ben and Jack have half their top layer with light strata. It means that they worked mostly the very last day before the deadline. Alan has a different work pattern than Jack as his middle layer is filling up 80%.

Related Publications
- Visual Sedimentation. Samuel Huron, Romain Vuillemot, Jean Daniel Fekete.
Related Links
- Visual.ly article.
