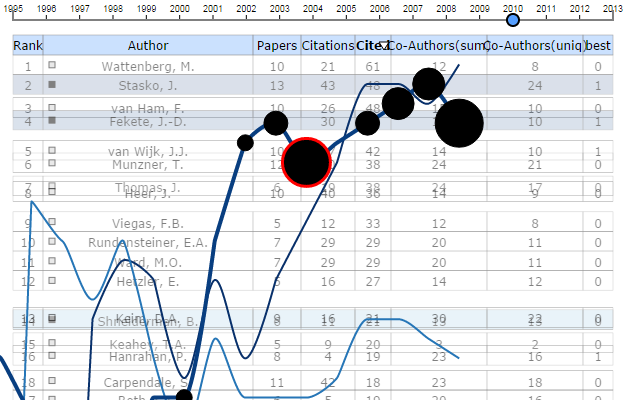
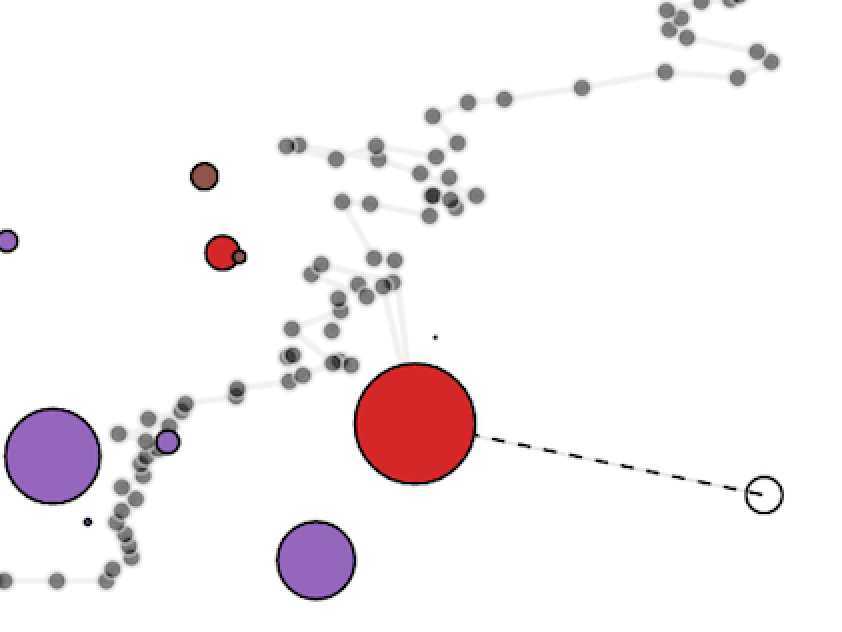
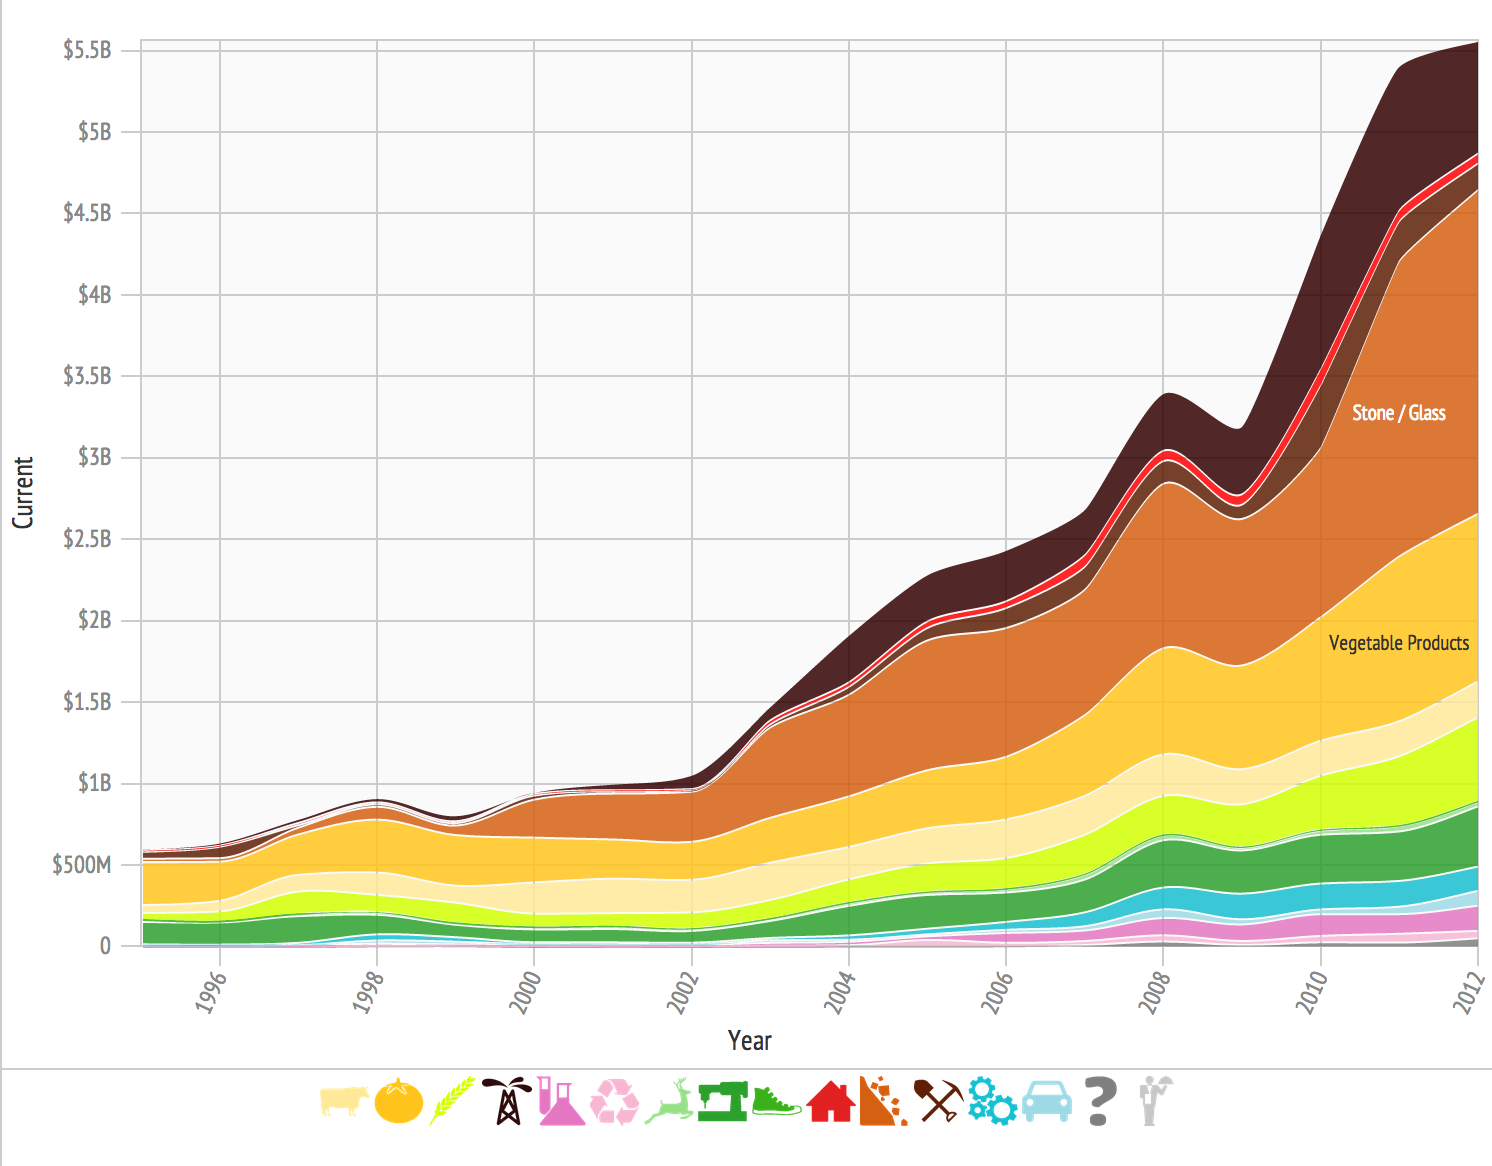
Projects MecaSport Space occupation to study influence of 3-points shot performance. Dataviz Mock-Ups Create rapid and realistic dataviz mock-ups. Tournament Predictions Sports Tournament Predictions Using Direct Manipulation. Colombian Atlas of Economic Complexity Visualization of countries trade and growth opportunities over time. Mexican Atlas of Economic Complexity Visualization of countries trade and growth opportunities over time. Scale of World Economies 1 dot 100 Million $ of Exports visualized in WebGL. Direct Rankings Investigating the Direct Manipulation of Ranking Tables. Text Search for Visualization We investigate the use of text search to retrieve information visualizations. Gapminder Re-Recreation Using countries trails to control their motion. À Table! An enhanced soccer ranking table improving time navigation. World Cup 2014 Predict Worldcup'2014 results The Atlas of Economic Complexity Visualization of countries trade and growth opportunities over time. Twitter M&M's SVN commits visualization before a deadline. Visualizing the Crunch of the Deadline SVN commits visualization before a deadline. Spirograph Designs Design variations for Spirographs to display Tweets. Visual Sedimentation A novel design metaphor for streaming data updates visualization. SoccerStories Visualization of soccer games. Watch Multiple Videos at Once Multiple videos displayed at once. French Unemployment Data Exploration Using a JavaScript version of ScatterDice. Bubble-t Twitter visualization for 2012 French presidential elections. Pause your INBOX! Scholarly text analysis using tag clouds. ← Home