
This project was made public in August 2015 and received significant attention from various media source (see link to main articles at the bottom of the page).
Latest project: The Globe of Economic Complexity http://t.co/qzFDmZeX7r coded by Owen Cornec @WikiGalaxy #webgl pic.twitter.com/jb9gyR6o3w
— Romain Vuillemot (@romsson) August 25, 2015
The Globe of Economic Complexity by Owen Cornec & Romain Vuillemot.https://t.co/iQhPHAoJ7j pic.twitter.com/IBs4mQzZVr
— Experiments with Google (@ExpWithGoogle) September 10, 2015
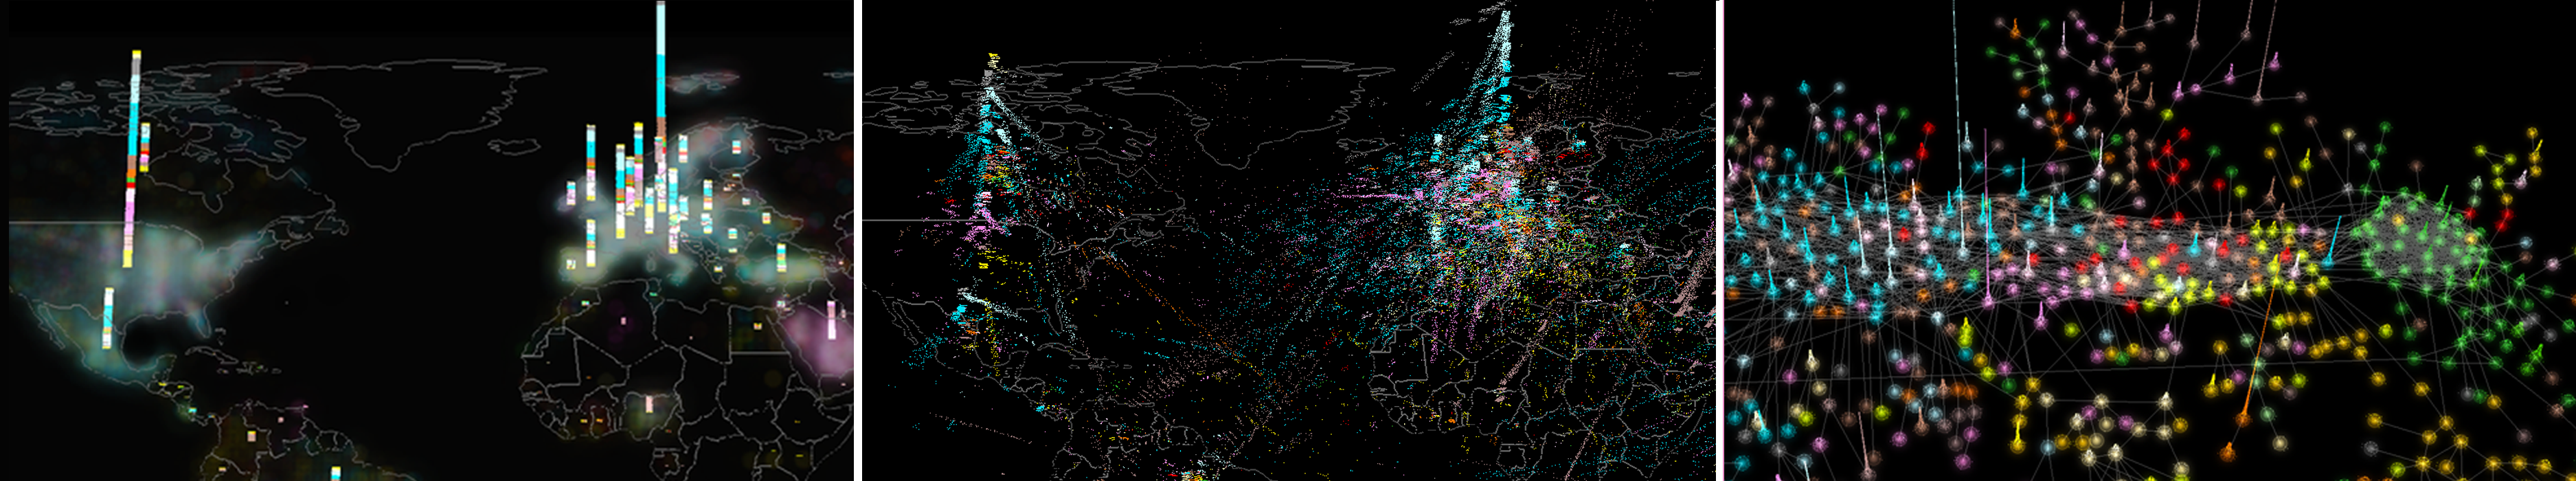
We’ve generated a lot of short GIF animation that aim at doing good justice to the various animation features we’ve used in the project.
We’ve presented the following poster at the IEEE Information Visualization Conference in Chicago in October 2015. We received a Best poster, honorable mention for it.
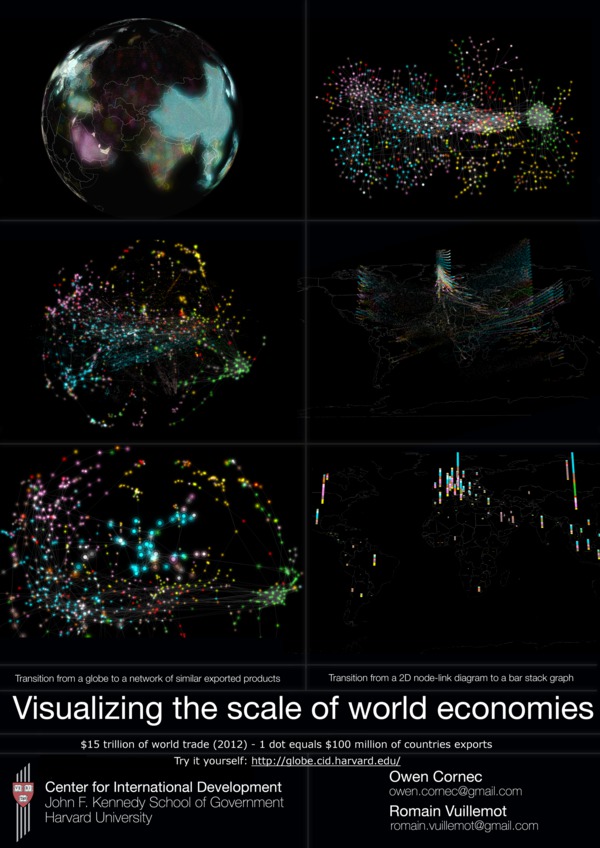
The video below is a companion to the submitted and presented poster.
In the News
The project has received a tremendous attention in terms of unique visits but also in press coverage. Below are the mean articles we’ve collected ranging from tech blogs to mass medias.
- This Is What $15.3 Trillion of World Trade Looks Like, Vice Motherboard.
- Visualized: Global Trade As A Frenzy Of Color-Coded Pixels, Fastcodesign.
- Behold, $15 trillion of world trade in one interactive chart, Marketwatch.
- A new way of visualizing world trade, WEF.
- Visualized: Global Trade As A Frenzy Of Color-Coded Pixels, FactoDesign
- This Is What $15.3 Trillion of World Trade Looks Like, Motherboard / Vice
- “The Globe” Generates Innovative 3D Visualizations of World Trade, Harvard CID Press release.
- Chrome Experiment, Google Chrome.
- United Nations Comtrade Labs projects, United Nations.
- Information is Beautiful awards short list in interactive category
- Explore the world’s economy in Harvard’s trippy 3D map
- Contempla la magnitud de la economía mundial con este increíble mapa interactivo Gizmodo, ES.
- http://www.wired.co.uk/news/archive/2015-08/26/3d-global-economics-map, Wired UK.
- https://www.nextnature.net/2015/08/visualizing-the-world-economy/ NextNature.
- http://www.ghy.com/trade-compliance/reimaging-the-economic-complexity-of-global-trade/, Ghy.
Related Publications
- Using Concrete Scales: A Framework for Visual Depiction of Complex Measures. Fanny Chevalier, Romain Vuillemot, Guia Gali.
Similar Projects
- WikiGalaxy: Explore Wikipedia in 3D, Owen Cornec.
- SandDance, Microsoft Research.