
So you’re done with your data visualization project, after hours of sweat, ups and downs, and the satisfaction to get things done. But what’s coming next? Of course it highly depends on the reason you’ve built the visualization in the first place: contracting, school assignment, experiment or side project. I’ll talk about getting some feedback from the later.
Here is a dissemination checklist weither it’s a [quick] experiment(http://bl.ocks.org/romsson) very polished project substantial, or part of your company you might ask yourself: what are the best ways to quickly provide some exposure. Why getting some exposure you may ask? Primarily to have impact of course. But also to get some feedback, start discussions.
Before finishing
- Informal user testings: from colleagues, friends or a small number of people. This is usually cheap and already allows to detect most of usability issues.
- Cross-browsers validation: various browsers and internet connections.
Once done
- Code on GitHub may find some resonance if you have subscribers
- Your own Website / portfolio
Where to disseminate?
- Your own Twitter account. You might want to create a specific account, but I’m not a fan of it as it usually becomes obsolete. Hashtag?
- Reddit dataisbeautiful. Eventually add your as [OC] for own content. http://www.reddit.com/r/internetisbeautiful is an alternative.
- Other sub-reddit (e.g. http://www.reddit.com/r/economics) but usually by advertizing with a strong take away.
- Hacker News

http://ramiro.org/tools/reddit-post-times/#IAmA
There used to be good venues
- Visual.ly but now turn
- visualizing.org but is down
What are the criteria of success?
- Some resonance on twitter: RTs, favorites/likes, replies.
- Listed as best visualizations of the month http://www.visualisingdata.com/ or annual award http://informationisbeautifulawards.com
- Made it to currated list such as American Infographics (there is the possibility to submit your own work to them)
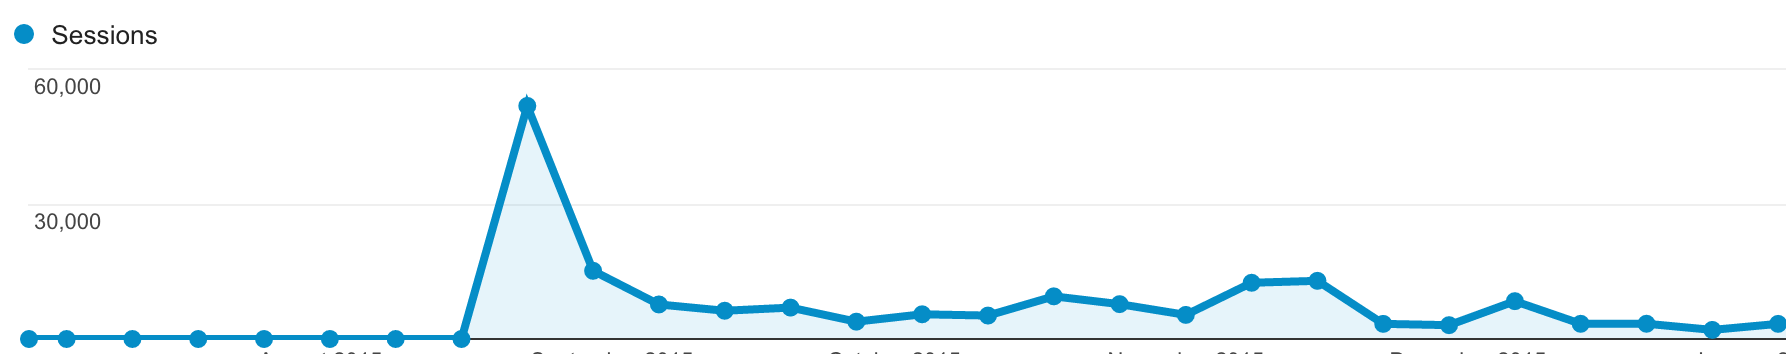
- Track views, bounce rate with Google Analytics
- Also track referrals, which will tell you what
- People re-blog your
- Don’t name drop in tweets to get the attention of big fishes on Twitter.
Tips
- Provide a Media kit including high resolution images, a press release.