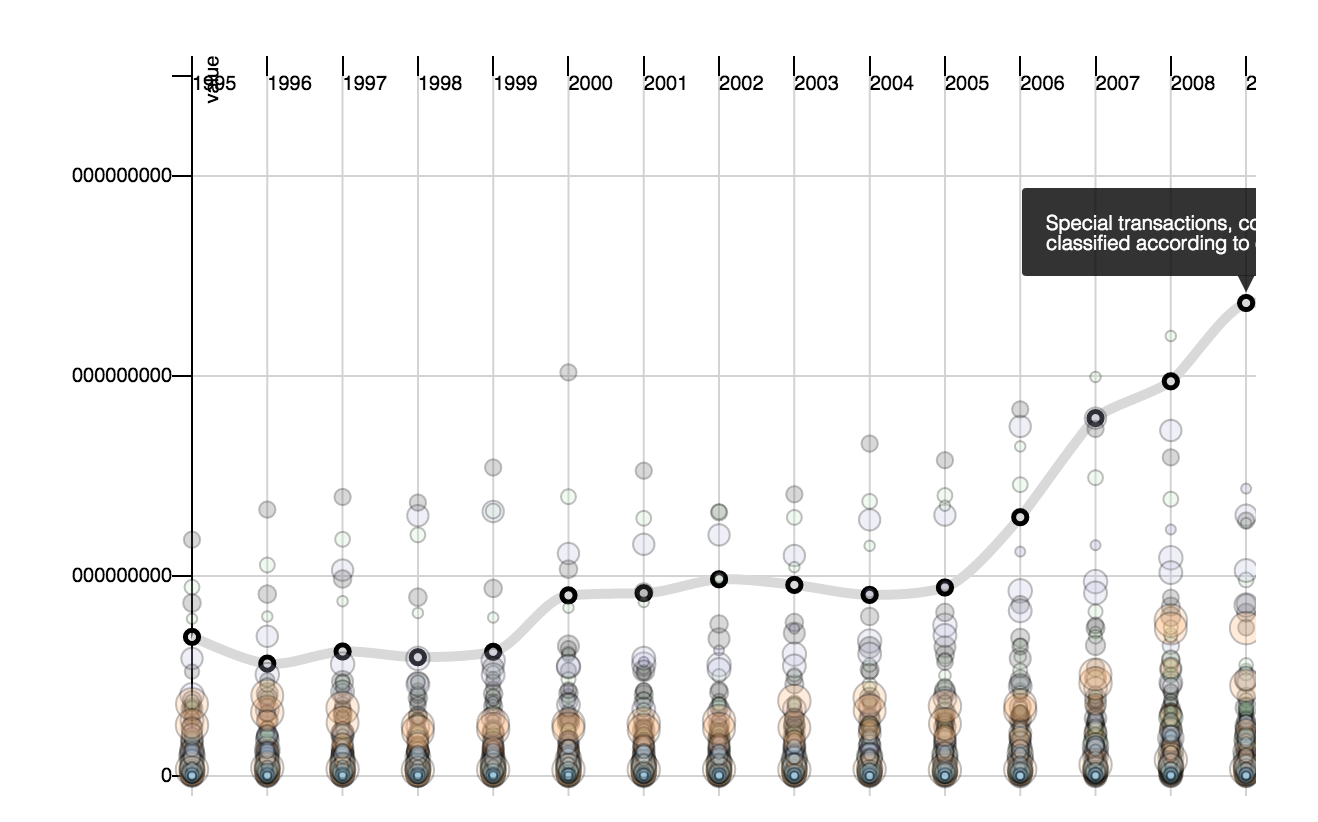
VisTK is an open-source JavaScript toolkit which allows the creation of standard charts such as scatterplots, bar charts, node-link diagrams and treemaps (see appendix for a more comprehensive list and illustrations). VisTK is intended to non-expert programmers, by easing charts creation using pre-defined templates. They consist in an abstraction layer over D3 that draws charts on web pages using low-level manipulation of SVG graphical elements (rectangles, circles, etc.). Templates provide default configurations, for marks position (scales, etc.) and visual properties (color, fill, etc.), to generate charts. Following D3’s recommendations, templates can be customized using Web Standards using CSS for aesthetics and JavaScript for interaction.

